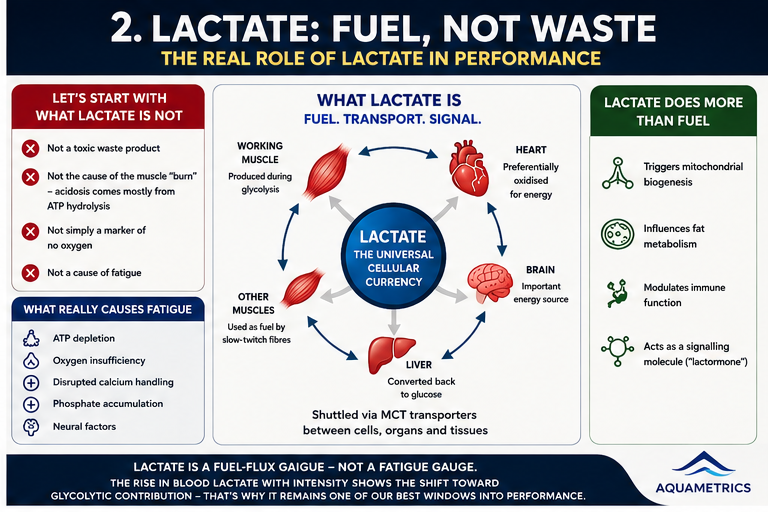
Let's start with what lactate is NOT
For sixty years, coaches have been told a story about lactate that simply isn't true. The story goes: lactate is a waste product, a toxic sludge produced when muscles run out of oxygen, the thing that "burns" in your swimmer's arms on the last 15m of a 200 and forces them to slow down. Fitter athletes, the story continues, produce less of it — so build the aerobic engine, starve the lactate, and everyone goes faster.
Almost none of that holds up.
Lactate does not cause the muscle acidosis that produces the burn — that acidification actually traces back mostly to the hydrolysis of ATP itself, not to lactate formation. Lactate is not an inevitable marker of "no oxygen available" — it is produced continuously, even at rest, even in fully aerobic conditions, and its production is driven far more by the rate of carbohydrate breakdown (glycolysis) than by any lack of oxygen. And it is absolutely not simply a fatigue-inducing waste product to be minimised. Contemporary fatigue research points to ATP depletion, oxygen insufficiency, disrupted calcium handling, phosphate accumulation and neural factors as the real drivers of muscular fatigue — lactate barely gets a mention anymore.
So what actually IS lactate?
Lactate is fuel. It is one of the most elegant pieces of metabolic engineering in the human body — George Brooks' "lactate shuttle" theory reframed it from a dead-end byproduct into a universal cellular currency that gets exchanged constantly between working muscle and the heart, the brain, the liver, and between fast and slow-twitch fibres, via a family of monocarboxylate transporter (MCT) proteins built specifically for the job. Lactate produced in one part of a working muscle can be shuttled straight into the mitochondria next door and burned for ATP. It can travel via the bloodstream to the heart and be preferentially oxidised there. It can be shuttled to the liver and rebuilt into new glucose. And beyond its energetic role, lactate acts as a genuine signalling molecule — nicknamed the "lactormone" — triggering mitochondrial biogenesis, influencing fat metabolism, and modulating immune function.
None of this means lactate concentration stops being useful — it means we've been reading a fuel-flux gauge and mislabelling it a fatigue gauge. The rise in blood lactate as intensity increases still tracks the shift from a heavily aerobic energy contribution toward a heavier glycolytic contribution — which is precisely why it remains one of the single best on-pool-deck windows into an athlete's metabolic engine, provided you understand what it's actually telling you.
How swimming has used it — and where that falls short
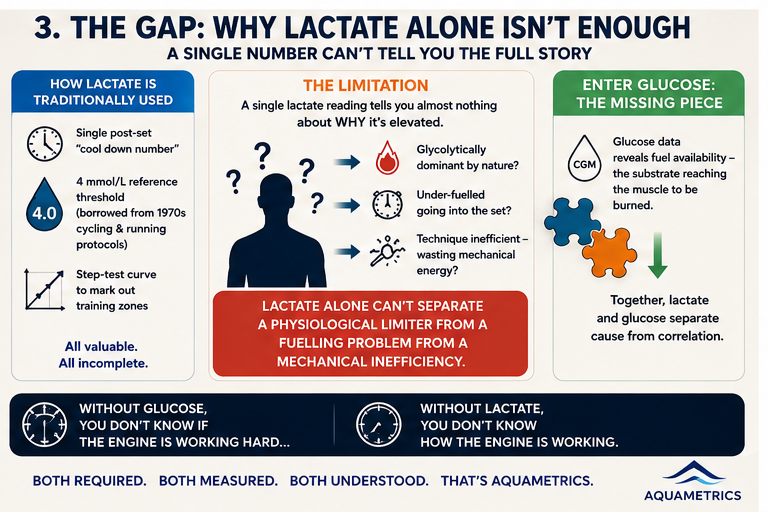
In the pool, lactate has traditionally been used in one of a handful of ways: a single post-set "cool down number," a 4mmol/L reference threshold borrowed from Mader's 1970s cycling and running protocols, or a step-test curve used to mark out training zones. All of these have value. But they share a common weakness: they treat lactate as a single, isolated number, disconnected from everything else happening physiologically in that swimmer, in that moment, on that pace.
A single lactate reading tells you almost nothing about why it's elevated. Is the swimmer glycolytically dominant by nature? Are they under-fuelled going into the set? Is technique costing them so much mechanical energy that they're recruiting anaerobic pathways earlier than they should at a given velocity? Lactate alone can't separate a physiological limiter from a fuelling problem from a mechanical inefficiency. And that is exactly the gap glucose data was built to fill.
Enter glucose — the fuel gauge lactate can't give you
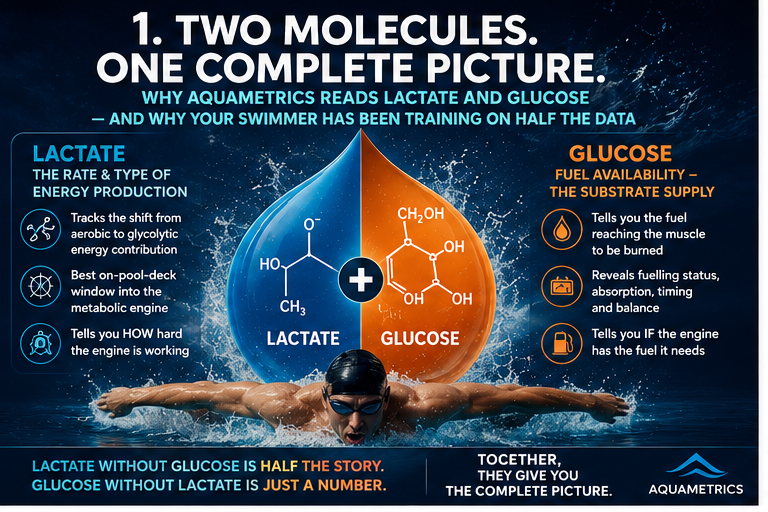
While lactate tells you about the rate and type of energy production, blood glucose tells you about fuel availability — the actual substrate reaching the muscle to be burned. Continuous glucose monitoring (CGM), long used in diabetes management, has in the last few years moved into elite sport, and the picture it has revealed in healthy, non-diabetic athletes is genuinely striking.
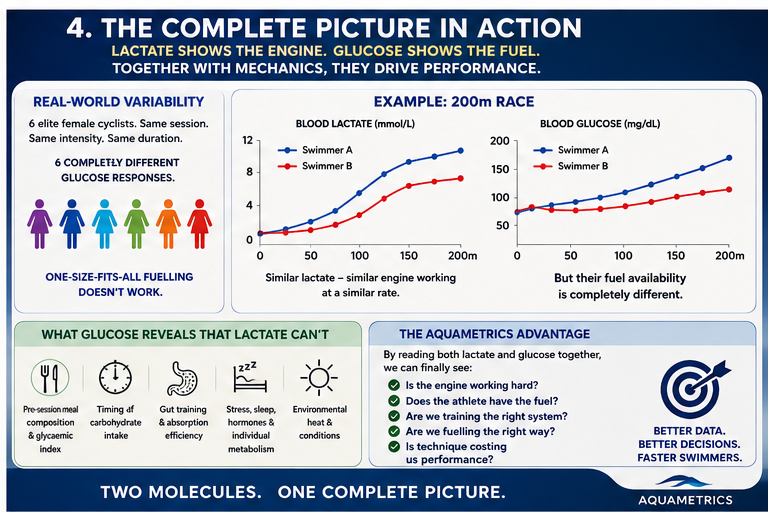
Elite endurance athletes routinely spend meaningful chunks of their day well outside the textbook "normal" glycaemic window of roughly 70–140 mg/dL — with elevated glucose during high-intensity work and, at other points in the day, dips below that range — and this is now understood as a normal physiological signature of a well-trained endurance athlete, not a red flag. World Tour cyclists profiled across a 9-day training camp showed mean in-ride glucose of around 108 mg/dL, but with individual peaks and troughs spanning from roughly 74 to 144 mg/dL depending on the day and the session. Six elite female cyclists riding the exact same session, at the exact same relative intensity, for the exact same duration produced six completely different glucose signatures — some rock steady, some swinging by 100+ mg/dL — which is the single clearest proof available that one-size-fits-all fuelling guidance simply doesn't survive contact with individual physiology.
Glucose responses are also shaped by things lactate can't see at all: pre-session meal composition and glycaemic index, the timing of carbohydrate relative to warm-up, reactive hypoglycaemia in the first 30 minutes of a session, competition-stress-driven hyperglycaemia in the minutes before a race starts, and overnight glucose patterns that can flag overreaching before performance ever drops. Separately, endurance-trained athletes have repeatedly been shown to run a different glucoregulatory playbook than untrained people altogether — sparing glucose at low-to-moderate intensity by leaning harder on fat oxidation, then producing pronounced hyperglycaemia at high intensity as hepatic glucose output outpaces muscle uptake. None of that is visible on a lactate strip. All of it is directly relevant to how a swimmer should be fuelled, paced, and programmed.
Why the combination is the whole point
Here's the piece almost nobody in swimming has put together: lactate and glucose are two views of the same metabolic engine, and neither view is complete on its own.
Lactate tells you the output side — how hard the glycolytic system is working at a given pace, and where the aerobic-to-anaerobic transition sits for this individual, on this day. Glucose tells you the input side — whether there's enough substrate arriving to support that output, and whether the swimmer's hormonal and hepatic systems are managing that supply smoothly or lurching between spikes and crashes. Put them together and you stop asking "is this swimmer's lactate high?" and start asking the far more useful question: "is this swimmer's lactate high because their metabolic engine is genuinely glycolytically dominant, or because they walked onto the pool deck under-fuelled and their glucose delivery couldn't keep pace with the demand?" Two swimmers can produce an identical lactate curve for two completely different underlying reasons — and you will only ever tell them apart by looking at glucose alongside it.
This is exactly the gap the AquaMetrics platform was built to close — not as a lactate tool, and not as a glucose tool, but as a genuinely combined physiological read that also folds in the one thing neither blood marker can measure directly: mechanical efficiency, via stroke rate, stroke cycle mechanics, and pace.
What that actually looks like on your deck
This is where it gets genuinely exciting for a coach.
The Adaptive Reference Curve (ARC) replaces the blunt, straight-line "Critical Speed" concept with a Froude-corrected, non-linear model of an individual swimmer's speed-duration relationship — producing a single anchor point, the Weighted Event Reference Point (WERP), calibrated specifically to that swimmer's event. Submax testing at event-scaled distances feeds directly into this model, and it's a fundamentally more accurate picture of where a swimmer actually sits than any generic critical-speed formula could ever be.
The variable-exponent lactate curve model — built and calibrated against a real 226-swimmer dataset — captures something fixed-exponent lactate models miss entirely: the exponent itself changes shape as a swimmer approaches threshold. That single refinement meaningfully cuts prediction error and now flags, automatically, when a swimmer's easy-pace-to-threshold gap is compressed — an early-warning sign worth a coach's attention long before it shows up in a race result.
The 2CA energy partition framework, built on Gt (the Glucose Turn Point) research, breaks each event down into its true aerobic, aerobic-glycolytic, and anaerobic energy contributions — for a 100m swim, that's roughly 12% aerobic, 21% aerobic-glycolytic, and 67% anaerobic — giving a coach an evidence-based blueprint for exactly how a race is actually fuelled, rather than a guess based on distance alone.
The 10-tier intensity zone system, running from a 12-hour-plus sustainable aerobic base through to 3–60 second CP-sprint work, is built lactate-first and inverted mathematically to generate velocities — meaning the training paces on the wall are derived from the swimmer's own physiology, not a percentage-of-best-time table borrowed from someone else's programme.
Planned-vs-actual session comparison, pulling directly from FIT files and coaching-software session data, closes the loop between what was written on the whiteboard and what actually happened in the water — instantly visible, instantly actionable.
And because it's built for a squad, not a single swimmer, group and sub-group assignment plus a full Season Planning view with intensity-distribution visualisation means a head coach can see, at a glance, whether the whole programme is trending pyramidal, polarised, or threshold-heavy — and adjust before a macrocycle runs its course rather than after.
The bottom line
Every other system on the market is still selling you half the picture — lactate without glucose, or glucose without lactate, and neither one connected to the actual mechanics of the stroke producing the speed. AquaMetrics puts the fuel gauge and the output gauge on the same dashboard, calibrated to real swimmer data, and translates it into training paces, race models, and early-warning flags a coach can act on tomorrow morning. If you've been making training-zone decisions off a single number from a single finger-prick, you haven't been seeing your swimmer's metabolism — you've been seeing a snapshot of it. It's time to see the whole engine.